16 years 6ヶ月 ago
2010年の競艇の新キャラクターになったアッキーナと千原ジュニアによるCMドラマ「Battle of 6 BOATRACE」。12月24日から本編開始とのこと...

16 years 6ヶ月 ago
ナショナル ジオグラフィックが創刊15周年スペシャルサイト「地球と、生きる」を公開。写真を選んでオリジナルフォトレターが作成できます。ショートストーリーが2月...

16 years 6ヶ月 ago
ソニーから、3Dに関連する製品・イベント情報を集約した「Sony Brings 3D Home in 2010」が公開。イベントレポートや、3D技術について紹...

16 years 6ヶ月 ago
「Yahoo!検索プラグイン」とは検索結果の内容をよりリッチに、また整理された見やすいフォーマットにて表示することで検索するお客様、検索されるサイト、そして機能...

16 years 6ヶ月 ago
株式会社サイバーエージェントが運営する、最大140文字のミニブログサービス「Amebaなう」は、2009年12月16日(水)に、著名人の投稿を集約したサイト「芸...

16 years 6ヶ月 ago
ツイッターで新年の抱負をつぶやける。ハッシュタグは「#newyearsresolution」。
noreply@blogger.com (Kenji)
16 years 6ヶ月 ago
アドウィークによる特集「Best of the 2000s」。考えさせられる。
noreply@blogger.com (Kenji)
16 years 6ヶ月 ago
Posted by パートナーデベロップメントチーム

この度、Google AdSense が、
JUGEM に導入されることになりました。これにより、Google AdWords の広告主の皆様は、JUGEM に対して
コンテンツターゲットで広告を配信することが可能となります。
JUGEM は国内で有名なブログサービスです。Google コンテンツターゲットをご活用いただく際の参考情報として、サイトの特性は以下の通りです。
ブログユーザ属性ブログ利用者は 10 代から 30 代までの女性ユーザの割合が多く、積極的に情報発信する世代が利用しています。

閲覧者属性閲覧者については、社会人と主婦の比率も高く、また年収世帯も比較的高い層にも利用されています。

ブログ利用者、閲覧者共に、ターゲットしやすいユーザ属性を誇っております。まだコンテンツターゲットを試したことがないお客様も是非この機会にお試しください。
--
*データ出典元:
JUGEM PC 媒体資料 2009 年 4-6 月

noreply@blogger.com (Google Japan Blog)
16 years 6ヶ月 ago
明日(12月17日)に開催するCSS Nite in Ginza, Vol.42(Shift 3)のタイムテーブルです。あくまでも目安であり、当日の流れによって、調整しながら進行します。
各セッションは10分です。ぜひ、筆記用具をご持参ください。
| 時刻 | 進行 | 講演者 |
|---|
| 18:10 | 開場 | |
| 18:20 | TRAVATAR | 1PAC, INC. |
| 18:30 | 開演/オープニング | |
| 18:35 | 各セッション開始(それぞれ10分) | |
| | ツールの進化とこれからの制作環境 | 鷹野 雅弘 |
| | チェックしきれてなくても安心! 2009年の海外Webデザイン総まとめ | 原 一浩 |
| | あしたのRIA ~ 進み続けるために知っておきたいこと ~ | 新谷 剛史 |
| | JIS X 8341-3改定により、2010年に現場で起こる変化を大胆予測 | 植木 真 |
| | 2009年から2010年にかけてのコーディング事情 | 益子 貴寛 |
| | 不景気から学べる今後のサイト制作のありかた | 長谷川 恭久 |
| 20:00 | 終了 | |
- アップルストア銀座でのCSS Niteは、いつも19:00スタートですが、この回のみ18:30スタートです。
- 当日枠は50席ほどです。
- twitterのハッシュタグは「#shift3」です。
ご参加される方は、CSS Nite in Ginza, Vol.42:ご入場に際し | CSS Nite公式サイトをご一読ください。

16 years 6ヶ月 ago
Hiromi.Ibukuro@gmail.com (衣袋 宏美(いぶくろ ひろみ))
16 years 6ヶ月 ago
Google Analytics公式ブログから。http://analytics.blogspot.com/2009/12/multilingual-urchin-6602-now-available.html新しい機能は下記の通り。・Enhanced LDAP integration (more protocols supported)
・1-Click Installer -- no need for an "outboard" database anymore
・GeoDB user adjustments -- don't need the full GeoDB? Run fast & light with Urchin 6.602
・Updated compression utility -- allows data archives greater than 2GB
・Option to select which profiles (and their overview data) to display on users' default "home" screen (aka, roll-up report)
・Bing.com support (hooray!)
・lots of bug fixes and documentation updates
Hiromi.Ibukuro@gmail.com (衣袋 宏美(いぶくろ ひろみ))
16 years 6ヶ月 ago
Hiromi.Ibukuro@gmail.com (衣袋 宏美(いぶくろ ひろみ))
16 years 6ヶ月 ago
そう言えば12/15日の昼頃に、電通と電通総研名でアンケートが来た。
なるほど電通の「日本の広告費」はこうして作られるのか。なになに、「下記アンケートサイトにおいて、2010年1月8日(金)までにご回答いただきたく、お願い申し上げます。」
媒体費に関する調査 https://www.research-dentsu.jp/****
制作費に関する調査 https://www.research-dentsu.jp/****
(御社に該当するもののみご回答ください。)
ふむふむ、我が社はどちらに該当するんだろうなあ。。。
「このアンケートは全国の総額を推計するために各社様分を合算して集計をいたします。個々のご回答内容等を公表することは、社内外を問わず一切ございません。」かあ。ウェブサイト管理・制作関係者各位と始まるアンケートだが、サンプリングしてなくて、手当たり次第にメールアドレス集めて、悉皆調査やっているのだろうか。。。謎。
媒体費調査:(これは広告を売っている会社向けのようだなあ)
[Q1]御社が取り扱う主要な広告媒体をお知らせください
[Q2]御社が広告媒体で扱うコンテンツやサービスの内容として、あてはまるものをすべてお知らせください
[Q3]御社では、2009年1月~12月の間に媒体費として広告主への請求が発生した広告媒体がありましたか。次の中からあてはまるものを1つだけお知らせください
[Q4]御社で2009年1月~12月の間に、広告主に請求した広告金額(広告の制作費含む)を概算でお知らせください。
途中省略
[Q22]2009年1月~12月の間の実績として、インターネット広告の制作費(タイアップを除く)がありましたか。インターネット広告の制作費(タイアップを除く)が発生した場合は、インターネット広告費全体に占めるおおよその割合をお知らせください。
うーん、結構しっかりした調査だ。
制作費調査:(こちらが制作会社向けか。どうやら我が社はこちらに想定されているようだ)
[Q1]あなたが勤務されている会社のおおよその人数をお知らせください。お一人で仕事をしている場合「1」人とお知らせください。
[Q2]御社が取り扱っている業務範囲のうち、あてはまるものをすべてお知らせください
[Q3]御社の2009年1月~12月の間の、全売上げを概算でお知らせください
[Q4]そのうち、2009年1月~12月の間の、Webに関する売上げを概算でお知らせください
[Q5]Q4でお答えいただいた「インターネット上の広告制作費」の定義にあてはまる売上げ(2009年1月~12月)はどの位でしょうか。概算で構いませんのでお知らせください。
→会社概要などのページ制作費は「広告」ではないから、対象外らしい。残念アクセス解析、SEOも対象外だ。0円でも協力した方がいいのかなあ。。。
などなどこちらは全12問だが実質的には数問、対象業種、目的などもきちんと聞いている。
勉強になった。
Hiromi.Ibukuro@gmail.com (衣袋 宏美(いぶくろ ひろみ))
16 years 6ヶ月 ago
Hiromi.Ibukuro@gmail.com (衣袋 宏美(いぶくろ ひろみ))
16 years 6ヶ月 ago
東急エージェンシーに入社後、コピーライターやテレビCMの作り手として活躍し、3年ほど前からクロスメディアのプロジェクトを手...
16 years 6ヶ月 ago
Hiromi.Ibukuro@gmail.com (衣袋 宏美(いぶくろ ひろみ))
16 years 6ヶ月 ago
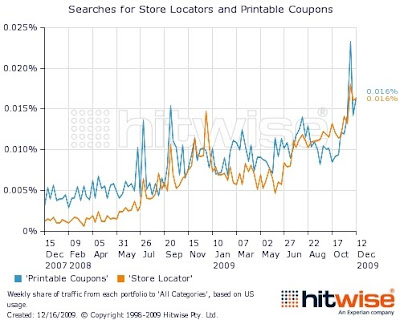
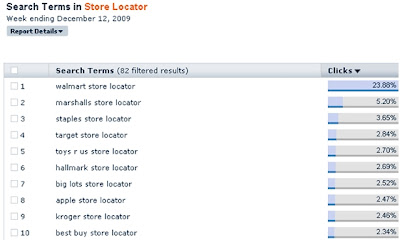
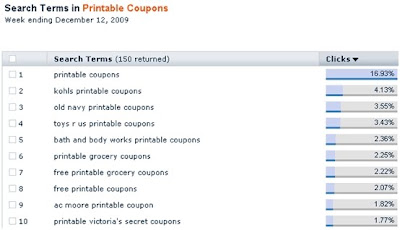
2009/12/16のHitwiseのブログから。

Hiromi.Ibukuro@gmail.com (衣袋 宏美(いぶくろ ひろみ))
16 years 6ヶ月 ago
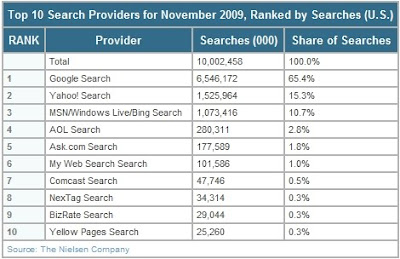
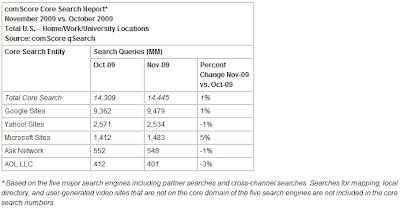
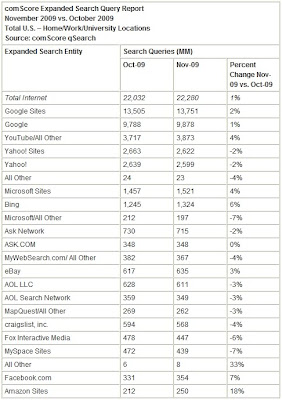
2009/12/16のcomScoreのリリースから。

Hiromi.Ibukuro@gmail.com (衣袋 宏美(いぶくろ ひろみ))
16 years 6ヶ月 ago
Hiromi.Ibukuro@gmail.com (衣袋 宏美(いぶくろ ひろみ))
16 years 6ヶ月 ago
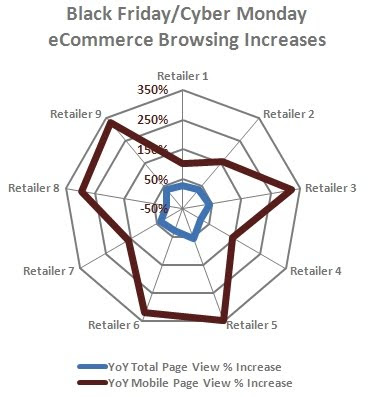
2009/12/16のomnitureのブログから。
米感謝祭頃のECサイト群のページビューの伸びをPCとモバイル別に比較したところ、どのサイトでも圧倒的にモバイル優位となったという。モバイルは日本の何年遅れくらいなんだろうか。

Hiromi.Ibukuro@gmail.com (衣袋 宏美(いぶくろ ひろみ))