16 years 5ヶ月 ago
ちょっと皆さんに見ていただきたい映像があります。
120秒の超感動巨編です!(うそ)


(注)最初はちょっとローディングが長いですが、我慢して見てみてください!
これのどこが感動巨編なんだ!ですが(笑)、これ、自分でやるとビックリするくらい気持ちいい映像になります(via: ホットリンク内山社長)。
ほめられサロンもそうですが、人の顔や名前で見るのと、自分の顔や名前で見るのとでは全く違う感覚になります。ジブンゴト化です(笑)
●参考:ほめられサロン


※過去エントリー:「ほめられサロン」がむちゃくちゃステキな件。
あと、先月のクリスマスのときに、うちのスタッフがみつけて、twitter上でもチロッとバズったこちら。


●こちらは広告会議さん篇(笑)

これも、自分の顔でやってみるとかなりウケます。
こういうコンテンツって最近あまりないけど、今回のHEROムービーははまりました。
ちょっと元気出ないなぁ・・・というときは、自分の映像をつくってみてください(超簡単にできます)。「人の顔で見るのと自分の顔で見るのでここまで感覚が違うのか」というジブンゴト化を体感してみてください。
HEROムービーは、おしっ!頑張ろっ!って元気になりますよ!お試しあれ。
16 years 5ヶ月 ago
2010年1月9日、ベルサール神田にてCSS Nite LP, Disk 8「G... CSS Nite実行委員会
16 years 5ヶ月 ago
aoi-dcからお正月コンテンツ「FuTube」が公開されています。名前を入力すると、あなたの2010年の姿を描いた予告編が再生されます。思わぬ映像がw...

16 years 5ヶ月 ago
ソーシャルネットワークマーケティングをはじめとするクチコミマーケティング市場の成長率は、ソーシャルネットワーク向けの広告費の伸びを上回るという。
noreply@blogger.com (Kenji)
16 years 5ヶ月 ago
2010年1月6日、ライカホリックスがクチコミ広告プラットフォーム「MyLikes」を公開。既存のリコメンデーション作成サービス「Likaholix」もそれに統合した。広告付きの推奨コメントを、ブログやツイッターに1日1回まで投稿できる。クリック単価は投稿者の影響力による。報酬は寄付することもできる。
------------------------------
MyLikes
http://mylikes.com/------------------------------
スポンサードツイートのビジネスは、すでにアドリー、アイゼア、ピアスクエアドなどが手がけている。ツイッターへのつぶやき1回で1万ドルを稼ぐ著名人もいるという。
noreply@blogger.com (Kenji)
16 years 5ヶ月 ago
博報堂DYメディアパートナーズとクウジットが、新聞広告に記載された専用の画像パターンを認識させることでスマートフォンに動画を配信するサービス「A-CLIP」を開発。
noreply@blogger.com (Kenji)
16 years 5ヶ月 ago
2010年1月8日、平和「CRルパン三世 徳川の秘宝を追え」がウェブサイトの地図上に隠されたお宝を探す懸賞キャンペーンを開始。
noreply@blogger.com (Kenji)
16 years 5ヶ月 ago
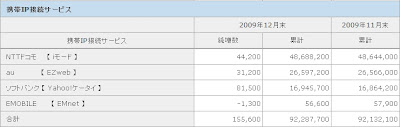
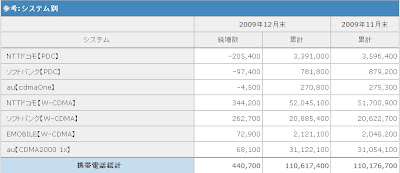
From the news of Telecommunications Carriers Associasion, 2010/1/8.They announces the number of subscriber by carriers.
Total subscriber of mobile phone in Japan is 110,617,400. The share of NTT docomo is biggest, about 50%.
IP service name of mobile phone by carrier is as follows;
i-mode: NTT docomo
EZweb: au(KDDI)
Yahoo! mobile: Softbank
The Share of mobile phone by system is as follows;
CDMA2000 1x:28.1%
W-CDMA:67.8%
cdmaOne:0.2%
PDC:3.8%

Hiromi.Ibukuro@gmail.com (衣袋 宏美(いぶくろ ひろみ))
16 years 5ヶ月 ago
Hiromi.Ibukuro@gmail.com (衣袋 宏美(いぶくろ ひろみ))
16 years 5ヶ月 ago
アップルの「iPhone」または「iPod touch」からアドモブの広告ネットワークへのリクエストを分析すると、2009年1月から11月にかけてもっともリクエストが増加したのは日本で、3倍以上になっている。アメリカ以外のユニークユーザーは、同期間に39%から50%にまで増加した。
noreply@blogger.com (Kenji)
16 years 5ヶ月 ago
宣伝会議から良い本が出ました。
●宣伝会議編集部(編集)・TYOグループWEB事業(編集協力)「消費者の心に響くウェブサイトの作り方」宣伝会議ビジネスブック

良い本なので、ぜひ書店で手にとってみてください!
この本の中には、2008年11月から弊社企画・TYO-ID制作で実施した、ソニー・ミュージックネットワーク様の「こいうた100」の事例がドドーンと紹介されています!


で、こちらjに、トライバルメディアハウスの婚活王子、TRIBAL MARKETING LAB. の八木が写真付きで載っています(上部赤丸印)。
うーん、わかりづらい。
ということで、この正月に一緒にゴルフに行ったときのアップ写真をば(右)。

どうです? いい男でしょ!
スペックはこんな感じ(笑)
●氏名:八木宣成(ヤギノブシゲ)
●1973年3月22日の牡羊座、横浜生まれ
●現在36歳(♂)独身
●血液型:B型
●4人兄弟の次男(姉・兄・弟がいます)
●身長:176cm、体重62kg
●住まい:武蔵小杉の高層マンションに優雅な一人暮らし
●趣味:ギター(歴20年)、ゴルフ(平均スコア115)、旅行(47都道府県中42都道府県制覇)
●好きな食べ物:バームクーヘン(毎晩食べてる!机の引き出しはバームクーヘンでいっぱい)
●喫煙:しない
●お酒:少しだけ飲む(ビール一杯で顔が真っ赤になります)
●車:Fordトーラス(ベンチシート仕様!)
●定番デートコース:女性の家の近くまで車でお迎えにあがる→葉山の海が見えるレストランでランチ→七里ガ浜でお茶→江ノ島で夕日→湘南平で夜景堪能&ラッコダッコ→みなとみらい21でディナー→女性の自宅の近くまで車で送る、というプラトニックかつ1990年代から続く鉄板コースとなっております
●好きな女性のタイプ:気配りができて明るく元気で家庭的な女性
●お付き合いの特典:きっと彼が作詞・作曲をした曲を自身のギターで弾き語りしてくれます
ごくまれに、「36歳まで独身ってことは何かあるの?」という質問を頂きますが、全くそんなことはありません。僕と彼は20年来の友人でもありますが(高校2年:16歳からの付き合い)、いたってフツー、ドノーマルです。性格は温厚、優しく、基本的に「尽くしん坊(尽くす男)」です。品質は僕が保証します(5年間の保証書付き)
現在婚活中ですが、長時間労働を強いてしまっているため、なかなか良い方と出会う機会がありません。
我こそは!という方は、お気軽に私のtwitterまでご連絡ください。ツイノミしましょうw(私も保護者として同席しますw)。あ、私が邪魔という方は、直接八木のtwitterまでご連絡を。(ご連絡の際は、「イケダのブログを見た」と言って頂けるとスムーズですw)
twitterだと公開されちゃうからどうしてもハズカシイ!という方は、直接八木までメールください。(僕の検閲はかかりませんw)
では、ソーシャル婚目指して、「まずはお友達から」初めてくださる方、ご連絡、お待ちしておりますw
<追記>
このエントリーは本人の了承は得ておりますが、嫌がる彼を必死になだめて僕が勝手に書いたものです。そんな奥ゆかしい彼をどうぞ宜しくお願い致しますww
16 years 5ヶ月 ago
宣伝会議から良い本が出ました。
●宣伝会議編集部(編集)・TYOグループWEB事業(編集協力)「消費者の心に響くウェブサイトの作り方」宣伝会議ビジネスブック
良い本なので、ぜひ書店で手にとってみてください!
この本の中には、2008年11月から弊社企画・TYO-ID制作で実施した、ソニー・ミュージックネットワーク様の「こいうた100」の事例がドドーンと紹介されています!
で、こちらjに、トライバルメディアハウスの婚活王子、TRIBAL MARKETING LAB. の八木が写真付きで載っています(上部赤丸印)。
うーん、わかりづらい。
ということで、この正月に一緒にゴルフに行ったときのアップ写真をば(右)。
どうです? いい男でしょ!
スペックはこんな感じ(笑)
●氏名:八木宣成(ヤギノブシゲ)
●1973年3月22日の牡羊座、横浜生まれ
●現在36歳(♂)独身
●血液型:B型
●4人兄弟の次男(姉・兄・弟がいます)
●身長:176cm、体重62kg
●住まい:武蔵小杉の高層マンションに優雅な一人暮らし
●趣味:ギター(歴20年)、ゴルフ(平均スコア115)、旅行(47都道府県中42都道府県制覇)
●好きな食べ物:バームクーヘン(毎晩食べてる!机の引き出しはバームクーヘンでいっぱい)
●喫煙:しない
●お酒:少しだけ飲む(ビール一杯で顔が真っ赤になります)
●車:Fordトーラス(ベンチシート仕様!)
●定番デートコース:女性の家の近くまで車でお迎えにあがる→葉山の海が見えるレストランでランチ→七里ガ浜でお茶→江ノ島で夕日→湘南平で夜景堪能&ラッコダッコ→みなとみらい21でディナー→女性の自宅の近くまで車で送る、というプラトニックかつ1990年代から続く鉄板コースとなっております
●好きな女性のタイプ:気配りができて明るく元気で家庭的な女性
●お付き合いの特典:きっと彼が作詞・作曲をした曲を自身のギターで弾き語りしてくれます
ごくまれに、「36歳まで独身ってことは何かあるの?」という質問を頂きますが、全くそんなことはありません。僕と彼は20年来の友人でもありますが(高校2年:16歳からの付き合い)、いたってフツー、ドノーマルです。性格は温厚、優しく、基本的に「尽くしん坊(尽くす男)」です。品質は僕が保証します(5年間の保証書付き)
現在婚活中ですが、長時間労働を強いてしまっているため、なかなか良い方と出会う機会がありません。
我こそは!という方は、お気軽に私のtwitterまでご連絡ください。ツイノミしましょうw(私も保護者として同席しますw)。あ、私が邪魔という方は、直接八木のtwitterまでご連絡を。(ご連絡の際は、「イケダのブログを見た」と言って頂けるとスムーズですw)
twitterだと公開されちゃうからどうしてもハズカシイ!という方は、直接八木までメールください。(僕の検閲はかかりませんw)
では、ソーシャル婚目指して、「まずはお友達から」初めてくださる方、ご連絡、お待ちしておりますw
<追記>
このエントリーは本人の了承は得ておりますが、嫌がる彼を必死になだめて僕が勝手に書いたものです。そんな奥ゆかしい彼をどうぞ宜しくお願い致しますww