16 years 5ヶ月 ago
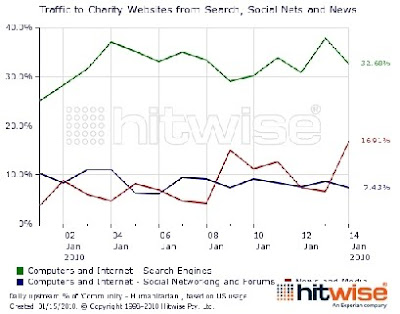
2010/1/15のHitwiseのブログから。
流入サイトは検索エンジン、ニュースサイト、SNSなど。


Hiromi.Ibukuro@gmail.com (衣袋 宏美(いぶくろ ひろみ))
16 years 5ヶ月 ago
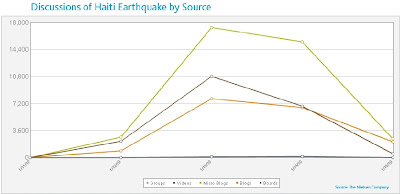
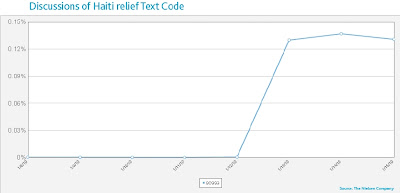
2010/1/15のNielsenのブログから。

Hiromi.Ibukuro@gmail.com (衣袋 宏美(いぶくろ ひろみ))
16 years 5ヶ月 ago
このエントリーは中学時代とかにオジーオズボーンを聞きまくったメタル好きな人にしか全くなんの関係もないんだけど、とりあえず最近ほぼ毎日見てしまう動画をご紹介(決してこのセクシー衣装が見たいわけではありません。テクを見ればわかります)。
この子、ちょっとすごい。いや、相当すごい(後ろにあるヒヨコのぬいぐるみは謎ですがw)。
不詳、僕も一応ギターが "家にある" 歴はもうかれこれ23年くらいになるし、高校の文化祭ではB'zバンドとか組んでギターを弾いてました。文化祭コンサートのギターソロでは、このMr. Crowley のギターソロを披露しましたが、まあここまで見事になんて弾けてません。本当にこのギターソロは難しい。そして名曲。
ちなみに、僕の(当時の)ギターの腕は、この子と同じくらいだったかもしれない(もしかしたらこの子の方がうまいかも)。
この少年もすごいです。ギターに弾かれてるくらい小さな体でまあよくここまで弾くなと。
あと、先ほどの少女の別動画。こちらは、同じくオジーオズボーンのBark at the moonです。もう最高です。シビレル!
あー、ギター復活させたいなぁ・・・。
16 years 5ヶ月 ago
2010/1/15のcomScoreのリリースから。


関連リンク:

Hiromi.Ibukuro@gmail.com (衣袋 宏美(いぶくろ ひろみ))
16 years 5ヶ月 ago
Hiromi.Ibukuro@gmail.com (衣袋 宏美(いぶくろ ひろみ))
16 years 5ヶ月 ago
Hiromi.Ibukuro@gmail.com (衣袋 宏美(いぶくろ ひろみ))
16 years 5ヶ月 ago
広告業のビジネスモデル変化については、いろんなところで語られている。このブログでも「広告業の将来」のエントリーで一部このことに触れた。メディア扱いによるマージンに頼る事業モデルはどんどん危うくなる。そ... ベム
16 years 5ヶ月 ago
米コカ・コーラによるプロモーション。大学キャンパス内に設置された自動販売機「Happiness Machine」が、みんなに幸せをご提供。...

16 years 5ヶ月 ago
「全員シロートの時代」という名言でおなじみの博報堂の須田和博氏の著書「使ってもらえる広告」をいただいた。「使ってもらえる広告」とは、いわゆるブランデッドユーティリティ、サービスとしての広告のこと。広告はその時代にもっとも影響力のあるメディアの似姿になるという洞察は鋭い。現場の悶々とした感覚が言語化されていて共感できる。この本は使える。
noreply@blogger.com (Kenji)
16 years 5ヶ月 ago
1月21日木曜日19:00からアップルストア銀座(3Fシアター)にて、原 一浩さん(karadesign/fxb)、矢野りんさんをお迎えし、CSS Nite in Ginza, Vol.43を開催します。
事前登録は終了しましたが、当日枠が40席ほどありますので、ぜひご参加ください。
お知らせ
ご入場に際し
mixiでの参加表明は、事前登録とは異なりますのでご注意ください。
「椅子席」で事前登録のある方
- エレベータで3Fにいらしてください。
- 受講票をご提示の上、「椅子席で登録」と口頭でお伝えください。受講票は回収しません。
- 後から来る方の「椅子取り」はできません。
- 18:50の時点で椅子席に余りがある場合には、立ち見の方を繰り上げます。
「立見席」で事前登録のある方
- エレベータで3Fにいらしてください。
- 受講票をご提示の上、「立ち見で登録」と口頭でお伝えください。受講票は回収しません。
- 18:50までは会場の両脇の通路でお待ちください。
- 18:50の時点で席が余っている場合には、先着順に席をお譲りします。
参加登録のない方(=当日枠をご利用の方)
- 当日枠は30席(+事前登録のキャンセル分)で、おおよそ35席分くらいです。
- 1F右手奥からの階段をご利用ください。
- 18:50からのご入場を予定しています(それまでは階段にてお待ちいただくことになります)。
- 当日枠でご参加されたい場合には、18:30くらいにご来場いただけると確実だと思われます。
- 定員180名を超える場合、ご入場をお断りする可能性があります。
CSS Niteに初参加の方へ
はじめてご参加される方へをぜひご一読ください。
注意事項
- CSS Niteに関しては撮影、録音などOKですが、アップルストア銀座の店内は、写真撮影不可です。
- アップルストア銀座の店内では飲食不可ですが、フタ付きのペットボトル等であれば問題ありません。
- アップルストア内でのお食事はご遠慮ください。
公開ポリシーとtwitter
- スライド、音声は、イベント終了後にCSS Nite公式サイトにて公開予定です。事前登録された方には、フォローアップメールにてもお送りします(アンケートにメールアドレスをご記入されても送信リストには反映されません)。
- セミナー中にスライドなどを撮影されたり、録音いただくことは問題ありません。ただし、個人利用(社内での勉強会などの利用)にとどめてください。
- 撮影いただく場合、携帯電話など、撮影時に音が出る機器はご遠慮ください。
- twitterを利用される方は、ハッシュタグ「#cssniteginza43」をご利用ください。
お願い
遅刻について
基本的に遅刻されてもご参加いただけます。ご連絡は不要です。
キャンセルについて
都合の悪くなった方はキャンセルフォームからご一報いただけると助かります。

16 years 5ヶ月 ago
明日(1月17日)、仙台青葉カルチャーセンター 403にて開催予定のdacha... CSS Nite実行委員会
16 years 5ヶ月 ago
1月21日木曜日19:00からアップルストア銀座(3Fシアター)にて、原 一浩さ... CSS Nite実行委員会
16 years 5ヶ月 ago
BPAワールドワイドが、フラッシュのクッキー(Local Shared Object)を訪問者の追跡に利用することの問題を指摘している。HTTPクッキーとは保存場所や削除方法が異なるうえ、そもそも認知されていないため、プライバシー問題の火種になるという。プライバシーポリシーへの記載やオプトアプトの支援を推奨している。
------------------------------
The Use of Flash Objects in Visitor Tracking: Brilliant Idea or Risky Business?
http://www.bpaww.com/Bpaww_com/HTML/flashcookieswp/------------------------------
noreply@blogger.com (Kenji)
16 years 5ヶ月 ago
第1期人間中心設計専門家書類提出締切は2010年2月1日(金)です。
詳細につきましては応募日程詳細をご覧ください。
申請書の書き方についてはQ&Aも参考にしてください。
16 years 5ヶ月 ago
2010年1月14日、ナイキがヨーロッパの6都市で利用できる都市探索アプリを公開。紹介ビデオは「セカイカメラ」のような拡張現実ブラウザを想起させるが、そのような解説は見当たらないので、実態はソーシャルマップと推測される。フェイスブックと連動している。日本からはダウンロードできない。
------------------------------
True City
http://www.niketruecity.com/------------------------------
noreply@blogger.com (Kenji)
16 years 5ヶ月 ago
2010年1月14日(木)、デジタルハリウッド本校(お茶の水)セミナーホールにて「帰ってきたWeb研」の第2回を開催し、100名ほどの方にご参加いただきました。
今回は、名村晋治さんを迎え、Webディレクションをテーマに開催。手を動かすワークや近くの方とのディスカッションもあり、参加して有意義だったという声をたくさんいただきました。
最後に、Web検定「Webディレクション」の模擬試験も行いました。ご参加いただいた方には、スライド、音声とともに、試験問題ごとの正答率などもフォローアップメールにてお届けします。

※瑕疵の読みは「かし」ですね。失礼しました。

16 years 5ヶ月 ago
2010年1月14日(木)、デジタルハリウッド本校(お茶の水)セミナーホールに... CSS Nite実行委員会
16 years 5ヶ月 ago
インターネットコムと goo リサーチが行った「ネット広告に関する定期調査(9回...
16 years 5ヶ月 ago
2010年1月14日、米Yahoo!検索広告担当バイスプレジデント David ...
16 years 5ヶ月 ago
2010/1/15のデジタルフォレストのニュースから。http://www.digitalforest.co.jp/archives/2010/01/web_7.html
デジタルフォレストは、Web解析ツール『Visionalist(ビジョナリスト)」の開発・販売と並行して、WebマーケティングROIを高めるためのサービス『Webコンサルティング』を提供しています。近年では、「アクセス解析」という概念の普及に伴って、さまざまなアクセス解析ツールのデータを活用した分析のニーズが増え、またアクセス解析を業務プロセスに取り入れ、ビジネスに活用する体制を作りたいという要望も多く寄せられています。このような背景より、デジタルフォレストではお客様の抱えている様々な課題に対応するために、『Webコンサルティング』のサービスメニューを拡充しました。今回新たに構築した『Webコンサルティング』サービス紹介サイトでは、豊富なメニューに加え、お客様の抱えている課題に対する解決策、サービス導入のメリットなどをわかりやすく紹介しています。以上がリリースの内容ですが、コンサルタントは、下記のラインナップですね。メディアでよく見る面々。手嶋 進(ディレクター)石井 陽子(チーフコンサルタント)吉川達彦(コンサルタント)山田 直之(コンサルタント)杉村 亮(シニアアナリスト)杉山 雅春(シニアアナリスト)大倉 友希(アナリスト)大熊 一美(アナリスト)
Hiromi.Ibukuro@gmail.com (衣袋 宏美(いぶくろ ひろみ))