Insight for WebAnalytics

国内企業のIT投資マインド、2010年度もIT投資抑制の意向

16 years 7ヶ月 ago
2010/2/15のIDC Japanのリリースから。

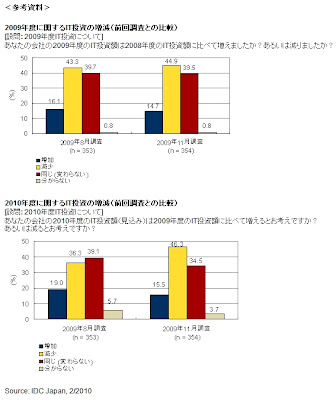
・2009年度のIT投資を2008年度に比べ「増加する」と回答した企業は、全体で14.7%と前回調査(2009年8月:16.1%)を下回り、IT投資マインドは慎重

・2010年度のIT投資を2009年度に比べ「増加する」と回答した企業は、全体で15.5%と前回調査(2009年8月:19.0%)を下回り、2010年度もIT投資抑制の意向

・2010年度のIT投資に関して、業種別では、製造およびその他(官公庁ほか)で削減する意向が他の業種より高い。従業員規模別では、規模が大きいほどIT投資マインドは慎重


[email protected] (衣袋 宏美(いぶくろ ひろみ))

米バレンタインで上昇したメール・マーケティング

16 years 7ヶ月 ago
2010/2/14のRetail Email Blogから


関連リンク:
[email protected] (衣袋 宏美(いぶくろ ひろみ))

米スーパーボウルを見ながら訪問するサイト、GoogleとFacebook

16 years 7ヶ月 ago
2010/2/12のNielsenのブログから。

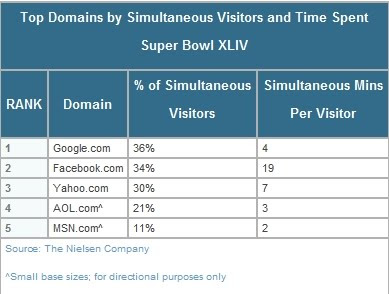
米スーパーボウルを見ながら少なくとも1回以上ネットに接続していた人の割合は14%になるという。その中で、どのようなサイトを見ていたかというデータだ。


[email protected] (衣袋 宏美(いぶくろ ひろみ))

2009年末米EC商戦、勝者は上位サイト

16 years 7ヶ月 ago
2010/2/12のcomScoreのブログから。

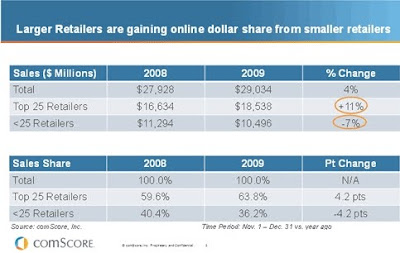
全体では売上が4%増ということだったが、上位25までは金額ベースで11%増加とよかったが、それ以下は逆に7%マイナスと厳しい冬だったようだ。


関連リンク:
[email protected] (衣袋 宏美(いぶくろ ひろみ))

米スーパーボウル広告主、Earned Mediaで最も効果があったのはDoritos

16 years 7ヶ月 ago
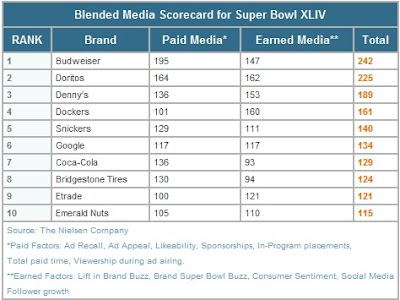
2010/2/12のNielsenのブログから。

この記事の主題はBlended Media Score。テレビ広告などのPaid MediaとブログなどのEarned Mediaの合計で広告主別にスコア化してみたということだ。


[email protected] (衣袋 宏美(いぶくろ ひろみ))

2009Q3、米メールの開封率22.0%、メールクリック率5.9%

16 years 7ヶ月 ago
[email protected] (衣袋 宏美(いぶくろ ひろみ))

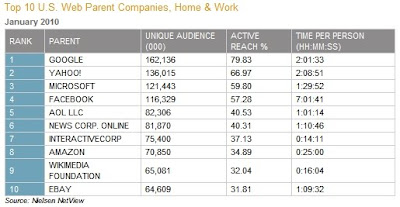
米Facebook、2010/1一人当たりの月間利用時間は7時間突破

16 years 7ヶ月 ago
[email protected] (衣袋 宏美(いぶくろ ひろみ))

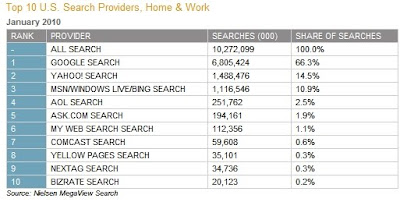
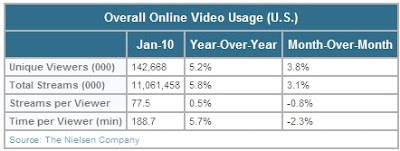
Bing(MS)のシェアは10.9%と上昇、米2010/1検索エンジン(Nielsen)

16 years 7ヶ月 ago
[email protected] (衣袋 宏美(いぶくろ ひろみ))

米複数語による検索割合、5ワード以上が19.0%

16 years 7ヶ月 ago
[email protected] (衣袋 宏美(いぶくろ ひろみ))

2010/1、日本のtwitter.com月間利用者、自宅からだけでも357万人に

16 years 7ヶ月 ago
[email protected] (衣袋 宏美(いぶくろ ひろみ))

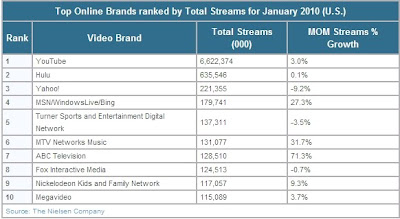
2010/1米YouTube、66.2億回の動画閲覧に

16 years 7ヶ月 ago
[email protected] (衣袋 宏美(いぶくろ ひろみ))

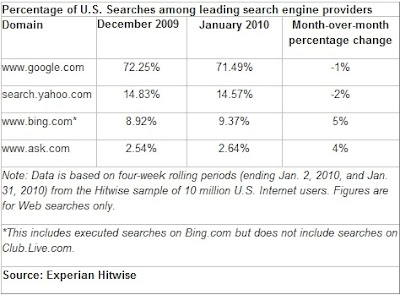
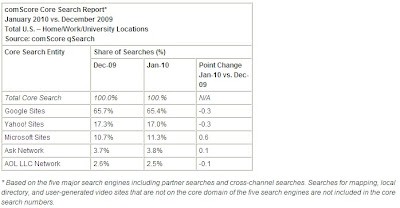
Bing(MS)のシェアは11.3%、米2010/1検索エンジン(comScore)

16 years 7ヶ月 ago
[email protected] (衣袋 宏美(いぶくろ ひろみ))

Dec 2009, Advertising sales decline 14 consecutive month

16 years 7ヶ月 ago
Japanese Ministry of Economy, Trade and Industry release the industry statistics of Dec 2009.
http://www.meti.go.jp/statistics/tyo/tokusabido/result/result_1.html

Internet advertising rise 5.3% compared to Dec 2008.

The chart below shows % up or down compared to same month last year.
And the meaning of column (from left to right) is as follows;
total sales, 4 mass media total, newspaper, magazine, TV, radio, ...., internet, others.


Related link:
Nov 2009, Advertising sales decline 13 consecutive month
[email protected] (衣袋 宏美(いぶくろ ひろみ))

2010/2/6の週の米検索エンジンシェア、Googleが71.35%

16 years 7ヶ月 ago
[email protected] (衣袋 宏美(いぶくろ ひろみ))

2010/2/6の週の英検索エンジンシェア、Googleが89.47%

16 years 7ヶ月 ago
[email protected] (衣袋 宏美(いぶくろ ひろみ))

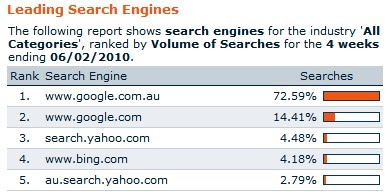
2010/2/6の週の豪検索エンジンシェア、Googleが87.0%

16 years 7ヶ月 ago
[email protected] (衣袋 宏美(いぶくろ ひろみ))
確認済み
2 時間 30 分 ago
Insight for WebAnalytics フィード を購読

人気記事トップ10

人気記事ランキングをもっと見る